Environmental Data
The OKI Group uses an environmental data system to collect and publish data for the entire group.
Environmental performance data, such as greenhouse gas emissions (Scope 1, Scope 2, and Scope 3), is verified by a third party.
Third-Party verification of CO2 emission data
| Verification contents | Scope | Target year | Materials |
|---|---|---|---|
| Greenhouse gas (CO2) emissions | Verification target: SCOPE1 and SCOPE2, energy consumption, SCOPE3 | 2024 | Verification Opinion [0.73MB][PDF] |
Material balance
It shows the material balance from a life cycle perspective as an overall picture of environmental impact.
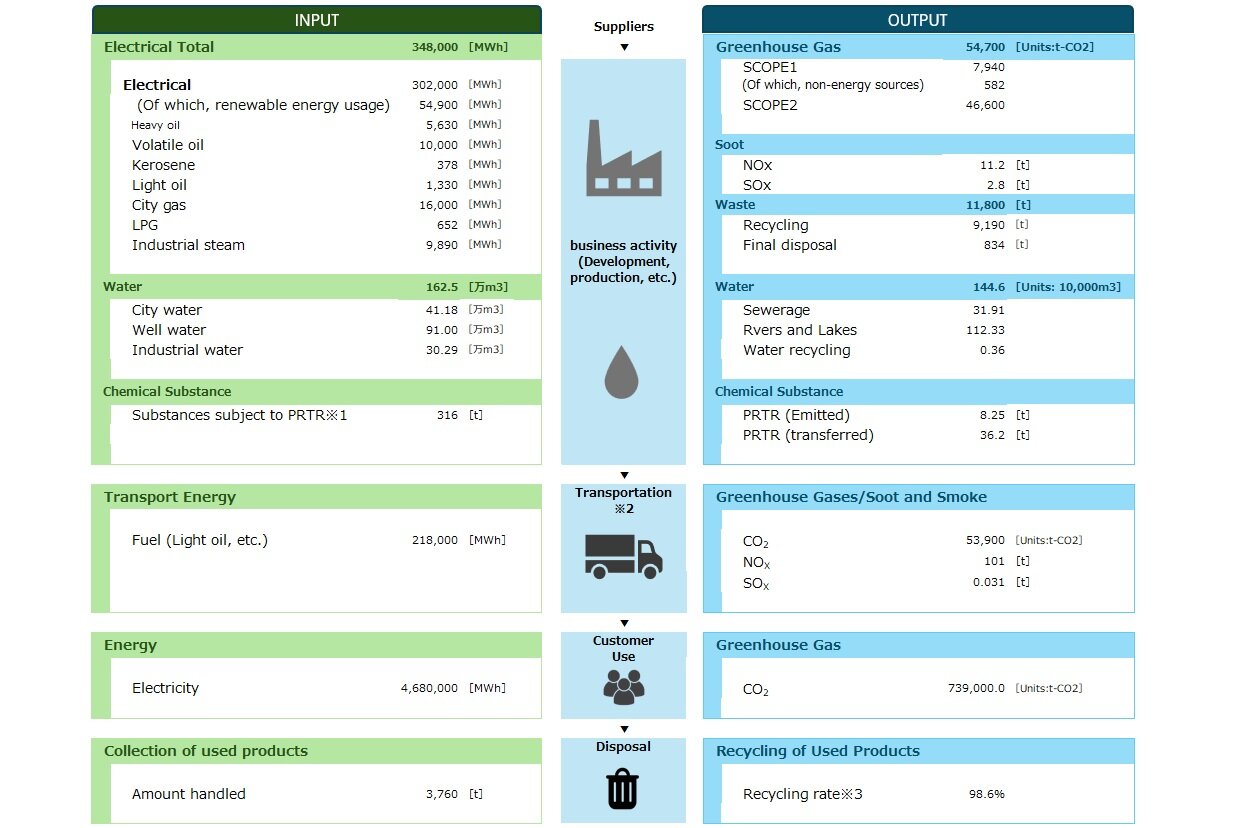
*1 PRTR: Pollutant Release and Transfer Register
*2 For transport, both INPUT and OUTPUT include company vehicles under business activities, aligning with the SCOPE 1 concept.
*3 Recycling Rate = 1 - Final Disposal Volume ÷ Total Handled Volume of Used Products
Greenhouse gas emissions
OKI Group CO2 Emissions Across the Entire Value Chain
| Category | Overview | Base Year (FY2020) | Emissions (Units:t-CO2) | |||
|---|---|---|---|---|---|---|
| FY2022 | FY2023 | FY2024 | ||||
| SCOPE1 | Direct emissions from in-house fuel use and manufacturing processes at OKI | 9,750 | 8,490 | 8,280 | 7,940 | |
| SCOPE2 | Indirect emissions from the use of electricity and heat purchased by the company by OKI | 68,700 | 62,400 | 51,800 | 46,400 | |
| SCOPE1+2 Total | 78,500 | 70,900 | 60,100 | 54,400 | ||
| SCOPE3 Upstream |
1 | Purchased goods and services (indirect emissions from manufacturing processes at suppliers) | 714,000 | 737,000 | 765,000 | 855,000 |
| 2 | Capital goods | 39,400 | 51,100 | 43,800 | 50,400 | |
| 3 | Fuel and energy-related activities not included in SCOPE 1 or 2 | 12,700 | 11,600 | 10,500 | 9,760 | |
| 4 | Transportation and delivery (upstream) | 51,500 | 105,000 | 51,200 | 53,900 | |
| 5 | Waste generated by the business | 2,580 | 2,950 | 2,880 | 2,650 | |
| 6 | Business travel | 4,210 | 7,000 | 8,610 | 10,800 | |
| 7 | Employee commuting | 7,180 | 6,920 | 6,870 | 6,680 | |
| 8 | Leased assets (upstream) | 677 | 570 | 530 | 488 | |
| SCOPE3 downstream |
9 | Transportation and delivery (downstream) | 6,720 | 8,210 | 8,050 | 5,310 |
| 10 | Processing of sold products | 31,000 | 40,000 | 39,200 | 35,000 | |
| 11 | Use of the sold product | 697,000 | 467,000 | 629,000 | 739,000 | |
| 12 | End-of-life treatment of sold products | 14,900 | 8,950 | 10,600 | 11,400 | |
| 13 | Leased assets (downstream) | - | - | - | - | |
| 14 | Franchise | - | - | - | - | |
| 15 | Investment | - | - | - | - | |
| SCOPE3 Total | 1,580,000 | 1,450,000 | 1,580,000 | 1,780,000 | ||
| SCOPE1+2+3 Total | 1,660,000 | 1,520,000 | 1,640,000 | 1,830,000 | ||
* Past figures have been revised based on feedback from a third-party verification organization.
Calculation method
| Category | Calculation method | |
|---|---|---|
| SCOPE1 | Energy Consumption x Emissions per Unit by Energy Type Based on Japan's Law Concerning the Promotion of Measures to Cope with Global Warming and the Law Concerning the Rational Use of Energy, CO2 emissions are calculated by calculating energy consumption for each type of energy and multiplying it by a CO2 emission factor. For city gas, CO2 emission coefficients published by each company are applied. |
|
| SCOPE2 | Electric power consumption x emission intensity + purchased steam x emission intensity Greenhouse gas emission factors used for CO2 emissions from electricity use are: Japan: Ministry of the Environment and Ministry of Economy, Trade and Industry "Emission Factor by Electric Utility" International: IEA Emission factors Purchased steam is the same as SCOPE1. |
|
| SCOPE3 upstream |
1 | Procurement amount of raw materials and materials x emission intensity by product |
| 2 | Amount of capital investment related to purchased capital goods x emission intensity by product | |
| 3 | Electric power, and amount of steam, cold water, and hot water used x emission intensity | |
| 4 | Transportation cost by transportation method x Emissions intensity by transportation method | |
| 5 | Outsourced waste treatment and recycling (volume) x emission intensity | |
| 6 | Travel expenses and number of nights spent on business trips x Emissions intensity | |
| 7 | Number of employees x number of working days x (by type of work and city) emissions intensity | |
| 8 | Consumption by energy type in leased assets × emission intensity by energy type (Limited to data centers leased (leased) by the OKI Group.) |
|
| SCOPE3 downstream |
9 | Post-process transportation cost x emission intensity *Applicable only to products manufactured by EMS (contract manufacturing) business |
| 10 | Sales of intermediate products × emission intensity | |
| 11 | Estimated useful life of product x Annual power consumption x Unit of sales x Unit of emission | |
| 12 | Amount of waste disposed of or recycled by type and treatment method x emission intensity (Limited to end-of-life products collected by the OKI Group.) |
|
| 13 | Not applicable. (The OKI Group does not operate a leasing business.) |
|
| 14 | Not applicable. (The OKI Group does not operate franchise businesses.) |
|
| 15 | Not applicable. (The industry category of the OKI Group is manufacturing, and the OKI Group does not invest.) |
|
Scope of calculation: Scope of consolidation stated in the securities report (excluding cross-shareholdings)
Emissions intensity of SCOPE3 used:
Domestic: 'Emissions intensity database for calculating the organization's greenhouse gas emissions through the supply chain'
Overseas: 'IDEA (Inventory Database for Environmental Analysis)' and 'IEA Emission Factors'
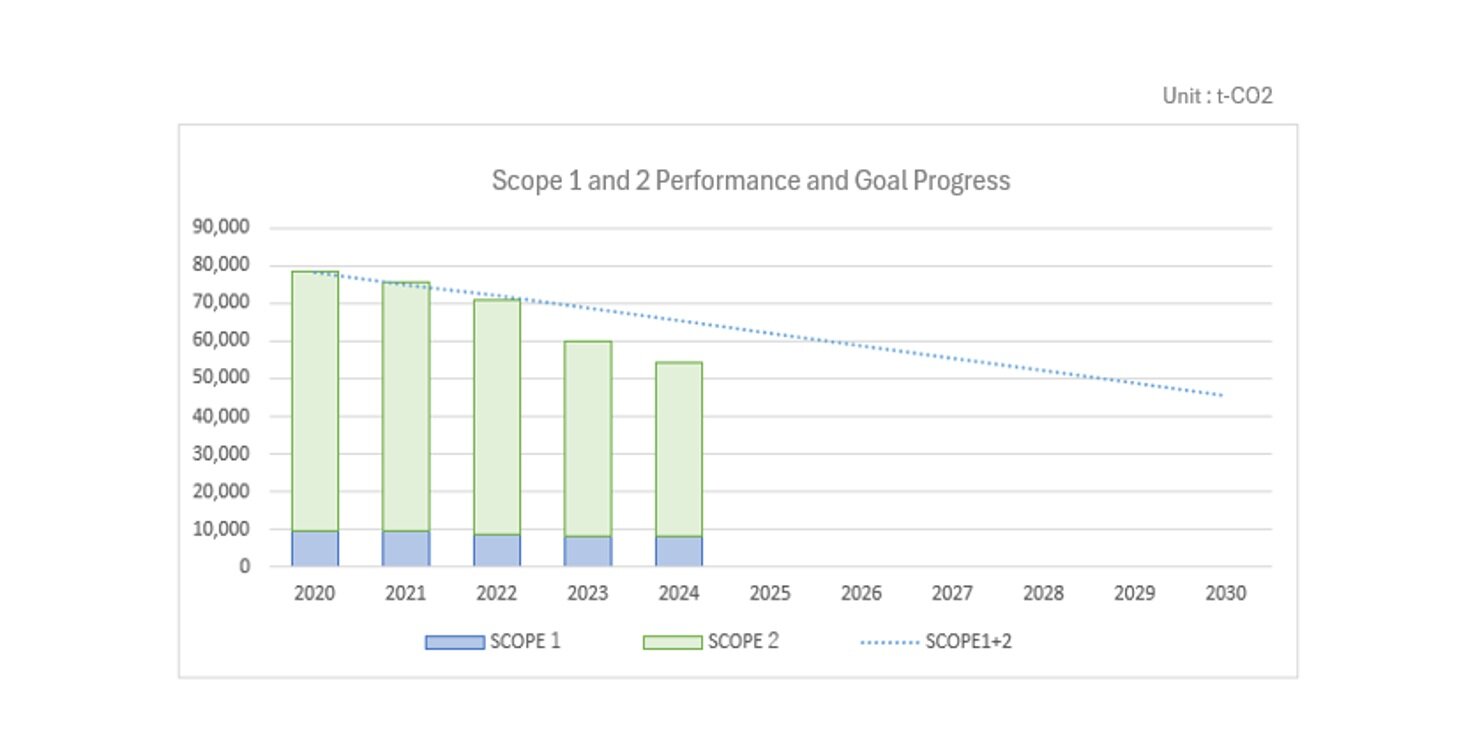
Goal achievement status
Goal Progress
OKI Group Environmental Vision 2030 Goal Progress
Based on the OKI Group Environmental Vision, which complies with Science-Based Targets (SBTs) (greenhouse gas reduction targets that are chemically consistent with the Paris Agreement), we have set a goal of reducing CO2 emissions from our business sites by 42% by fiscal 2030 (compared to fiscal 2020) and achieving net-zero emissions by fiscal 2050. We are working to achieve this goal with a medium- to long-term perspective.
Environmentally Contributing Sales Ratio
We are strengthening our efforts to address environmental issues through our core business, including by revising our definition in light of external circumstances, with the aim of creating and expanding environmentally contributing products that address climate change. Our goal is for environmentally contributing products to account for 50% of our total group sales by fiscal 2030.
| FY2025 Target | FY2024 Results |
|---|---|
| 35% | 45% |
Energy usage and CO2 reduction
CO2 emissions and energy consumption associated with business activities
Changes in CO2 emissions and basic unit (CO2 emissions per sales)
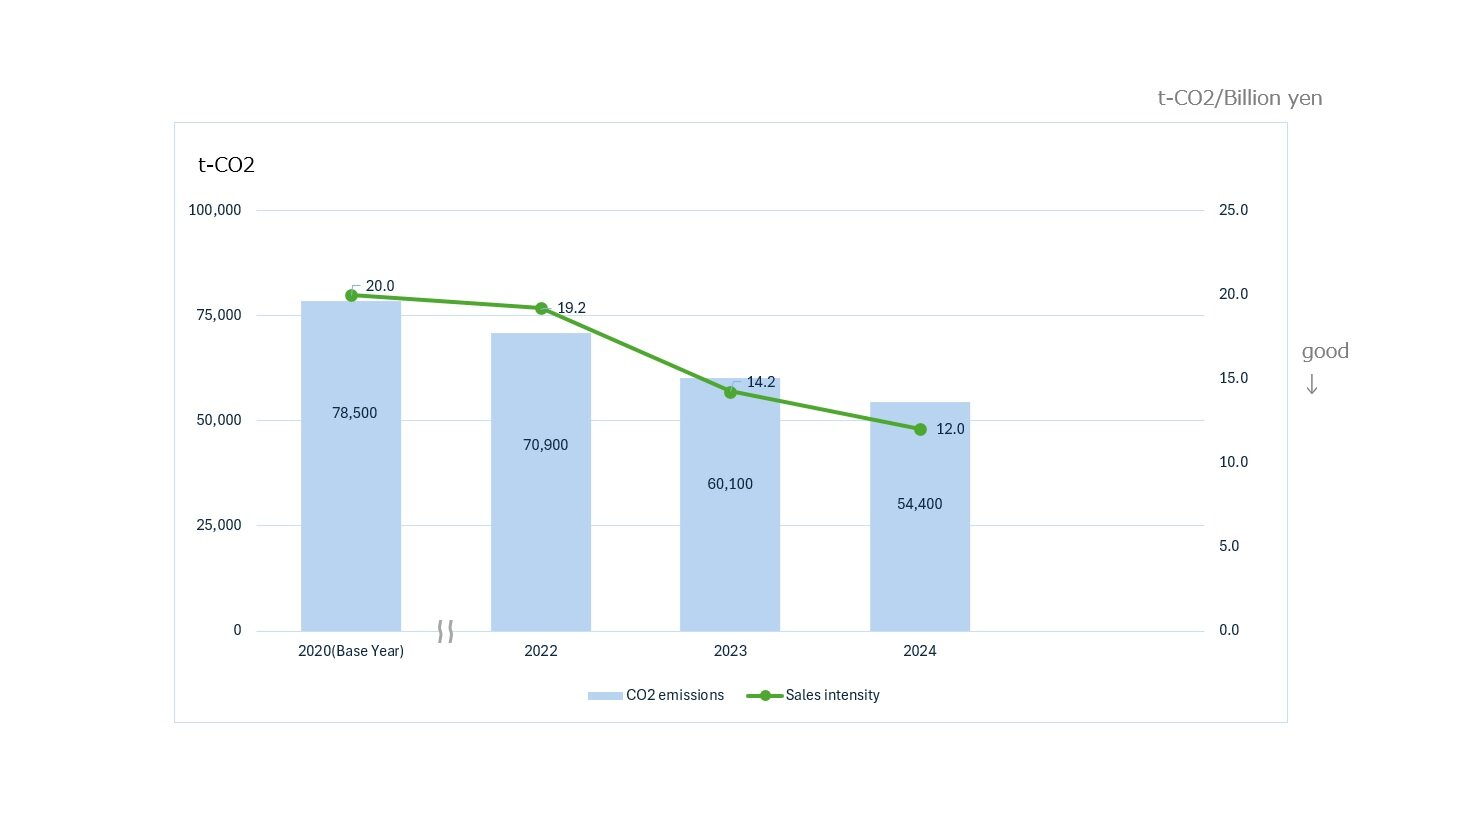
(Line is per unit of sales)
OKI Group Energy Consumption
Energy and renewable energy consumption in business activities
To achieve the SBT 1.5℃ target, we are promoting the introduction of renewable energy while thoroughly implementing energy conservation measures. From fiscal 2022, we will strengthen our renewable energy introduction, installing solar panels on our own facilities and purchasing renewable energy certificates such as non-fossil fuel certificates.
We are working on a variety of measures with the goal of reducing energy consumption by 0.4% or more compared to the previous year.
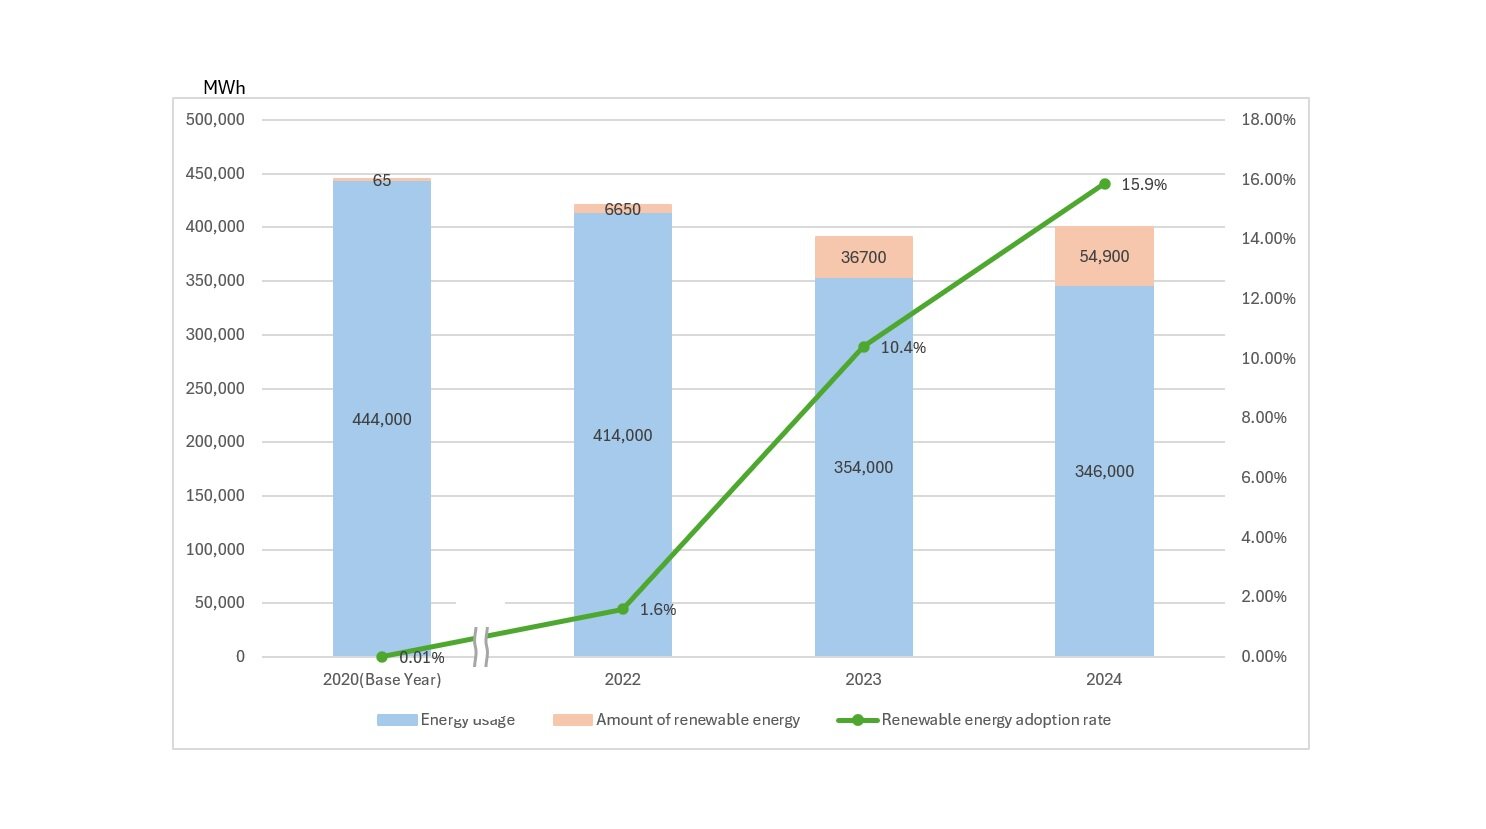
| 2020(Base Year) | 2022 | 2023 | 2024 | |
|---|---|---|---|---|
| Energy usage | 444,000 | 414,000 | 354,000 | 346,000 |
| Amount of renewable energy | 65 | 6,650 | 36,700 | 54,900 |
| Renewable energy adoption rate | 0.0% | 1.6% | 10.4% | 15.9% |
Waste and resource circulation
Promotion of Material Recycling
OKI Group's goal is to maintain the overall Material recycling rate *1 at the 2014 to 2018 level(84%).
Our performance in fiscal 2024 was 86%.
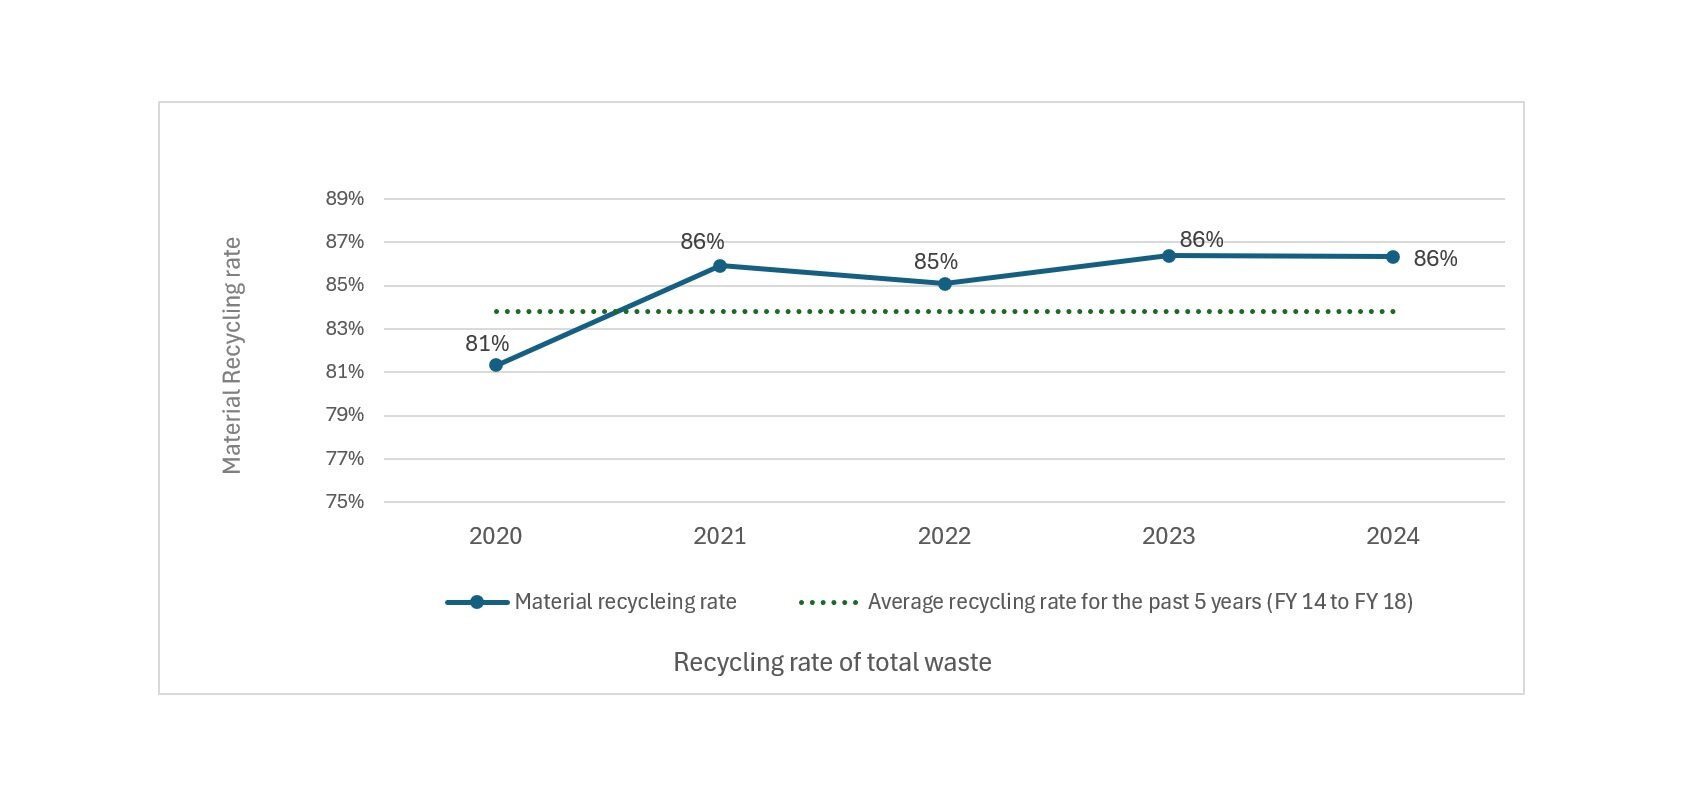
*1 Material recycling rate
(Amount of value sold + Amount recycled by consignees) / (Amount of value sold + Amount of entrusted disposal)
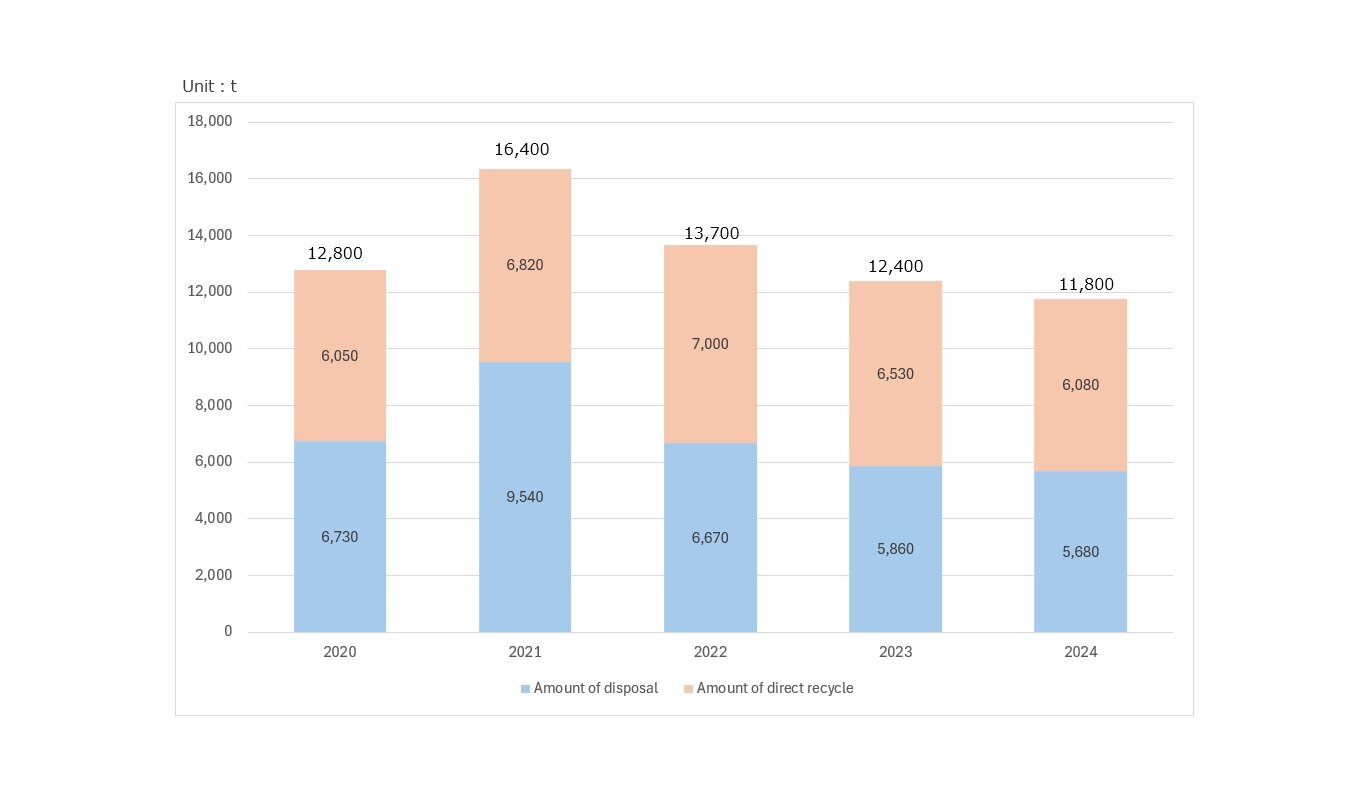
Total waste generated
Change in total waste generation across the OKI Group
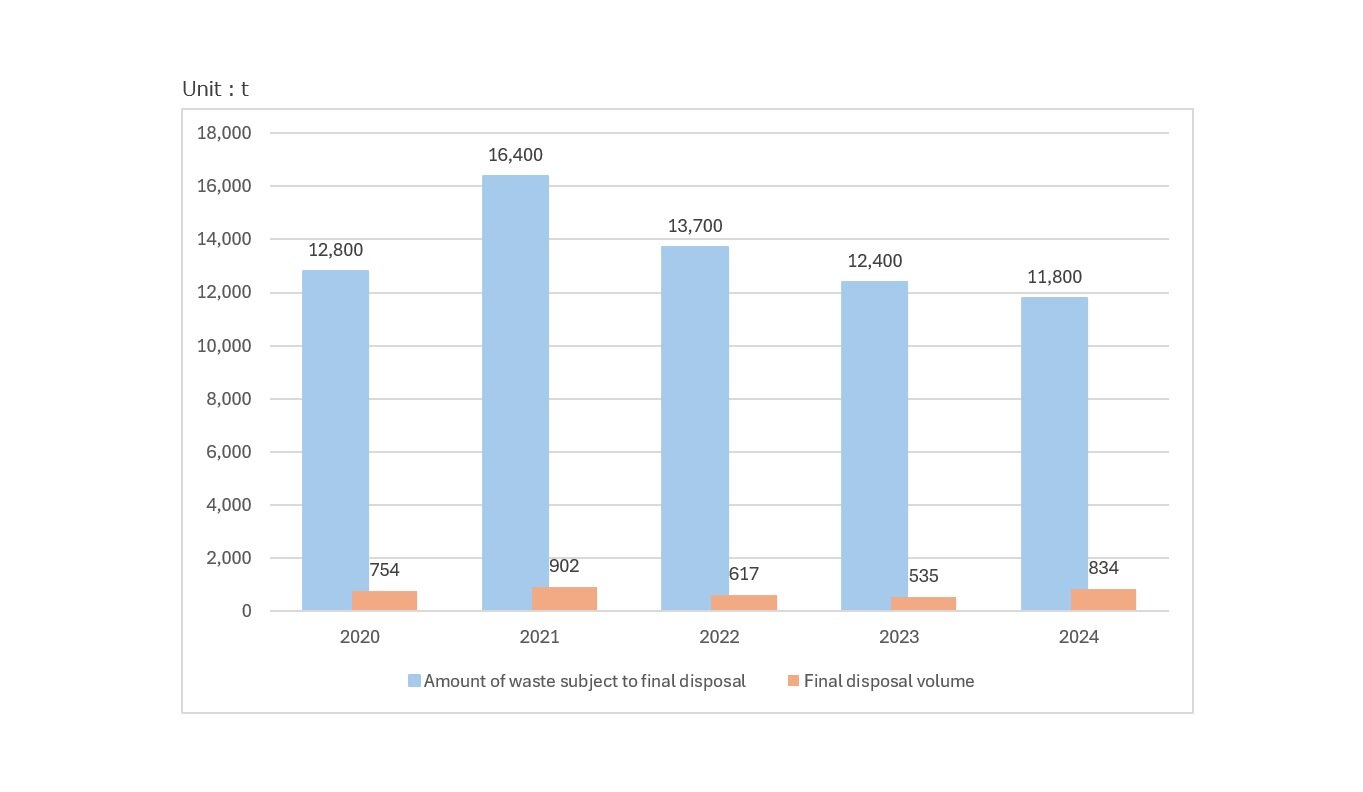
Total waste generation and final disposal volume
Trends in total waste generation and final disposal volume for the OKI Group
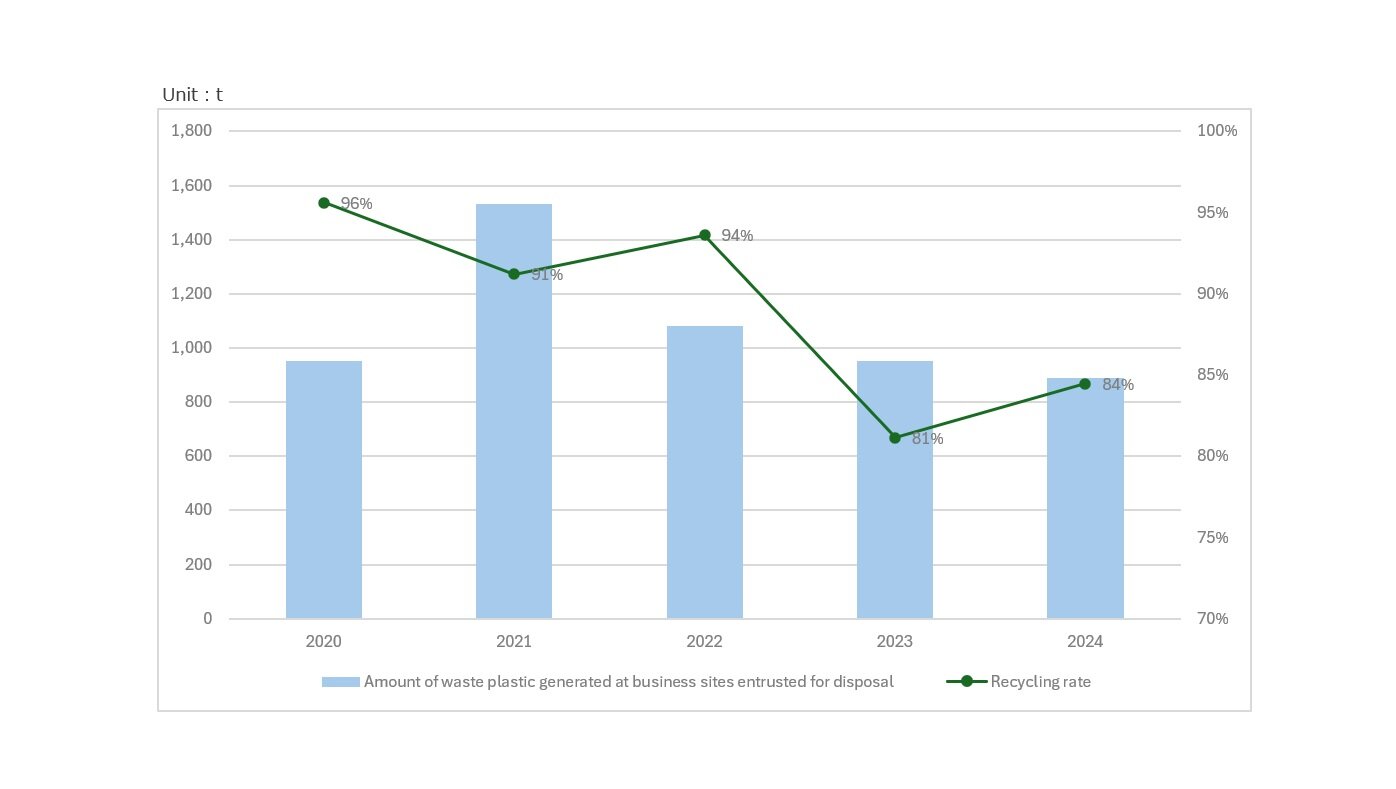
Initiatives for recycling plastic resources
OKI Group aims to maintain the recycling rate for waste plastics, just as it does for all waste materials.
The recycling rate for waste plastics in fiscal 2024 was 84%.
Material recycling rate of waste plastics
Trends in the amount of waste plastic entrusted for disposal and recycling rate
Activities for the reduction of plastic waste and recycling
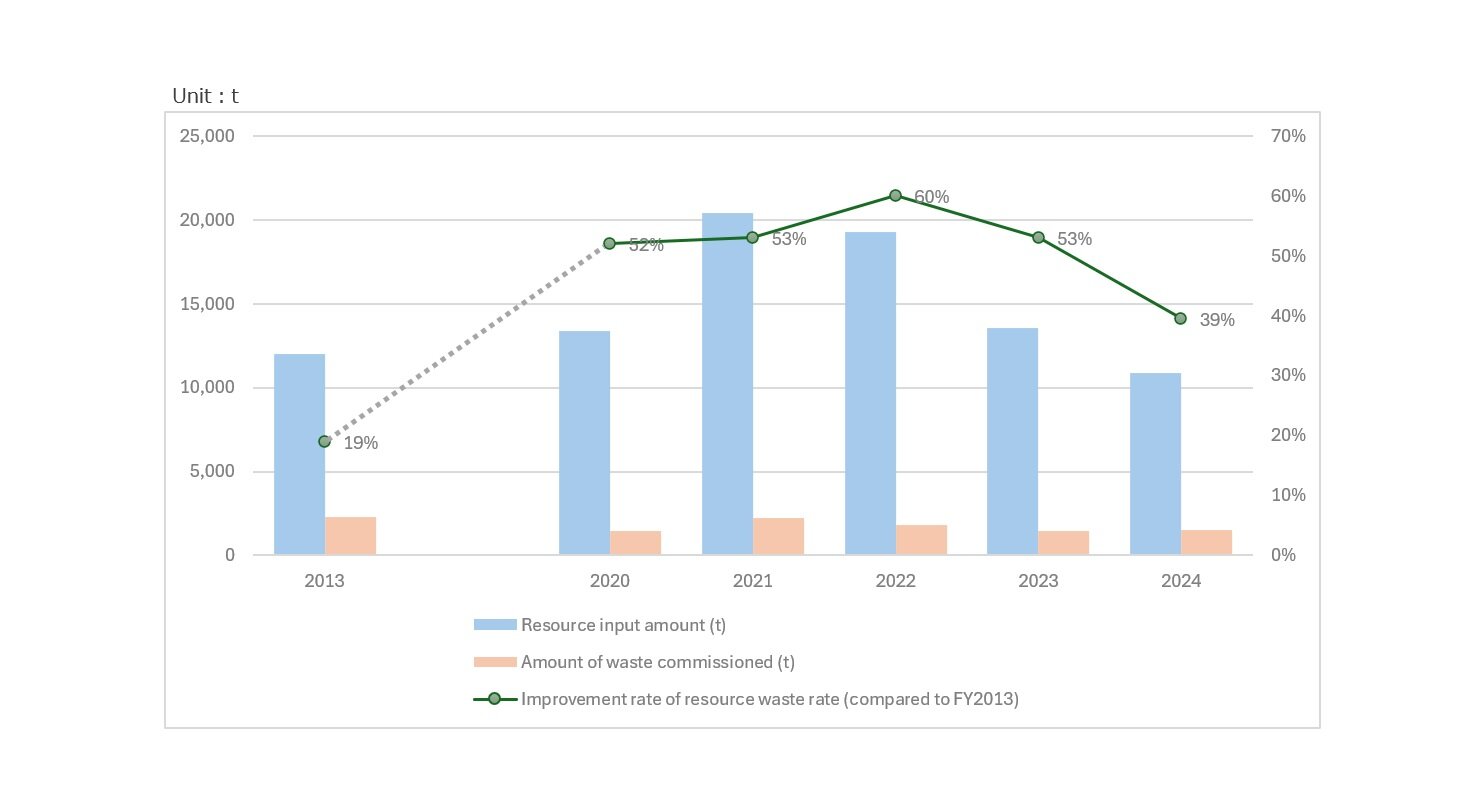
Resource waste rate
We analyze the resource waste rate to check the efficient use of resources. We are monitoring the situation with the base rate of 19% in 2013.
Hazardous waste
OKI Group will begin compiling data on hazardous waste from fiscal 2023.
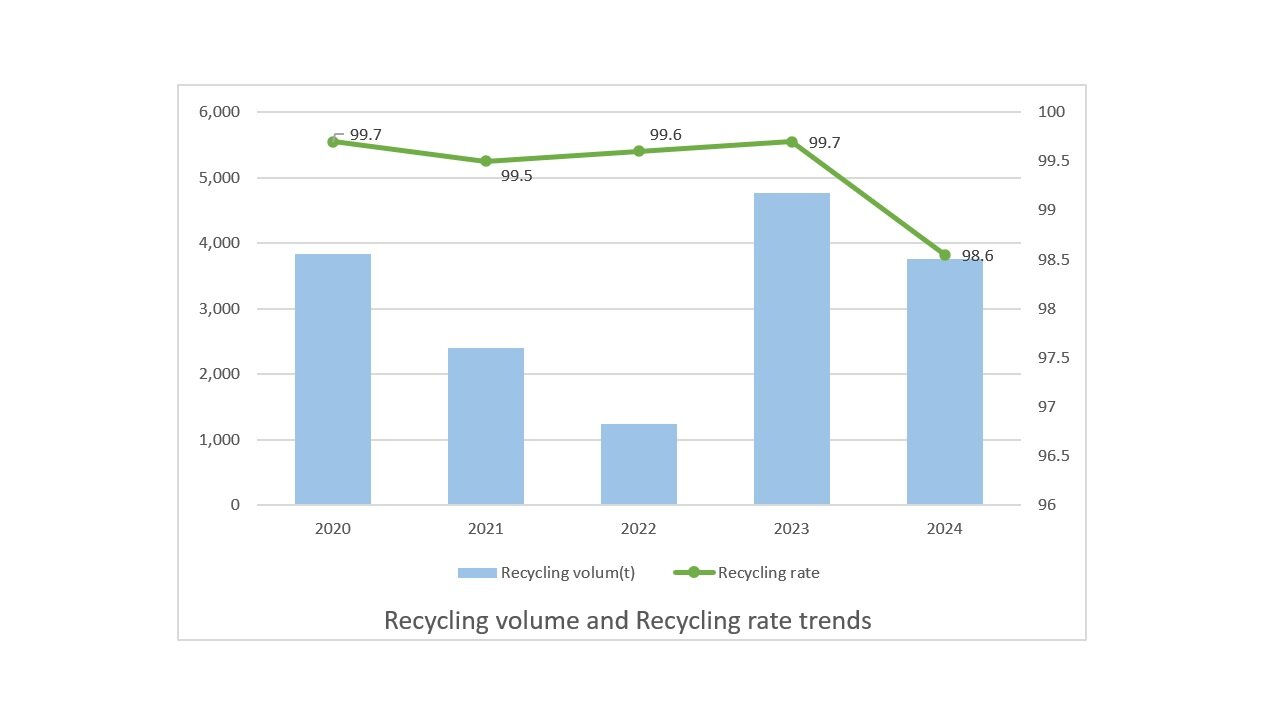
Recycling of Used Products
OKI and OKI Cross Tech actively utilize wide area certification system for industrial waste, which was granted by the Ministry of the Environment in June 2006, to promote the recycling of used products.
In fiscal 2024, the recycling amount was 3,760 tons, and the recycling rate was 98.6%.
Related information
Water usage and emissions
Details of water usage, drainage, and usage fees
As an example of water usage at our production bases in Japan, water used in the production process is neutralized and rendered harmless using chemicals before being discharged.
| Amount used [Quantity (m3)] | FY2022 | FY2023 | FY2024 |
|---|---|---|---|
| City water | 435,900 | 434,200 | 411,800 |
| Well water (= spring water, groundwater) | 966,600 | 897,400 | 910,000 |
| Industrial water | 358,200 | 328,100 | 302,900 |
| Water usage from surface water from rivers, lakes, and natural ponds | 0 | 0 | 0 |
| Amount of water derived from quarry water | 0 | 0 | 0 |
| Amount of water used from external wastewater | 0 | 0 | 0 |
| Amount of water used from collected rainwater | 0 | 0 | 0 |
| Seawater, sea, or water usage extracted from sea | 0 | 0 | 0 |
| Water of unknown origin | 0 | 0 | 0 |
| Total | 1,761,000 | 1,660,000 | 1,625,000 |
| Amount of wastewater [amount (m3)] | |||
| Amount of water discharged into the sewer | 325,900 | 355,500 | 319,100 |
| Direct dralnage to the ocean | 0 | 0 | 0 |
| Direct dralnage to rivers and lakes | 1,186,000 | 1,133,000 | 1,123,000 |
| Amount of water discharged into the underground and well | 0 | 0 | 0 |
| Amount of water recycled | 3600 | 3600 | 3600 |
| Total | 1,516,000 | 1,492,000 | 1,446,000 |
| Usage fee [1000 yen] | |||
| City water | 107,600 | 109,300 | 107,700 |
| Well water (= spring water, groundwater) | 28,200 | 22,800 | 23,100 |
| Industrial water | 16,500 | 18,100 | 17,400 |
| Total | 152,300 | 150,200 | 148,200 |
Related information
Chemical substance usage and emissions
Management of chemical substances used in production activities
As an example of water use at production sites in Japan, the water used in production processes is treated with chemicals to neutralize and render it harmless before being discharged. The chemical substances released into the atmosphere are mostly volatile organic compounds (VOCs) found in solvents used for cleaning parts in assembly plants. The OKI Group manages these substances by limiting the management to VOCs and substances specified by the PRTR Law, while also striving to substitute them with less environmentally impactful chemicals and reduce their usage.
Amounts of Major PRTR* Chemical Substances Used (FY2024 unit: tons)
| Name of chemical substance | Amount handled | Amount emitted | Amount of movement | ||||||
|---|---|---|---|---|---|---|---|---|---|
| Atmosphere | Public waters | Soil in the workplace | Subtotal | Transfer to sewage system | Taking out of office | Subtotal | Total | ||
| Antimony and its compounds | 15.9 | 0.0 | 0.0 | 0.0 | 0.0 | 0.0 | 14.6 | 1.3 | 15.9 |
| Ethylbenzene | 2.1 | 1.5 | 0.0 | 0.0 | 1.5 | 0.0 | 0.6 | 0.0 | 0.6 |
| Xylene | 2.8 | 1.9 | 0.0 | 0.0 | 1.9 | 0.0 | 0.8 | 0.0 | 0.8 |
| Cyclohexylamine | 1.4 | 0.0 | 0.0 | 0.0 | 0.0 | 0.0 | 0.0 | 0.0 | 0.0 |
| Water-soluble copper salts (excluding complex salts) | 233.0 | 0.0 | 0.0 | 0.0 | 0.0 | 0.0 | 0.0 | 8.9 | 8.9 |
| Toluene | 5.4 | 4.6 | 0.0 | 0.0 | 4.6 | 0.0 | 0.8 | 0.0 | 0.8 |
| Lead | 0.6 | 0.0 | 0.0 | 0.0 | 0.0 | 0.0 | 0.0 | 0.1 | 0.1 |
| Lead compounds | 0.1 | 0.0 | 0.0 | 0.0 | 0.0 | 0.0 | 0.1 | 0.0 | 0.1 |
| Nickel compounds | 9.9 | 0.0 | 0.0 | 0.0 | 0.0 | 0.0 | 1.0 | 1.1 | 2.1 |
| Water-soluble salts of peroxodisulfuric acid | 21.5 | 0.0 | 0.0 | 0.0 | 0.0 | 0.0 | 0.0 | 0.0 | 0.0 |
| Formaldehyde | 12.5 | 0.1 | 0.0 | 0.0 | 0.1 | 0.0 | 0.0 | 1.2 | 1.2 |
| Manganese and its compounds | 0.2 | 0.0 | 0.0 | 0.0 | 0.0 | 0.0 | 0.0 | 0.0 | 0.0 |
| Methylnaphthalene | 4.4 | 0.0 | 0.0 | 0.0 | 0.0 | 0.0 | 0.0 | 0.1 | 0.1 |
| Ethylenediaminetetraacetic acid and its potassium and sodium salts | 3.5 | 0.0 | 0.0 | 0.0 | 0.0 | 0.0 | 0.0 | 2.9 | 2.9 |
| Diethylene glycol monobutyl ether | 1.1 | 0.0 | 0.0 | 0.0 | 0.1 | 0.0 | 0.0 | 1.0 | 1.0 |
| Total | 316.0 | 8.1 | 0.1 | 0.0 | 8.2 | 0.0 | 18.0 | 18.1 | 36.2 |
* Chemical substance discharge grasp management promotion law
Environmental accounting
Environmental Conservation Costs
When the OKI Group makes capital investments to renew or introduce infrastructure, it selects equipment with low environmental impact. Capital investment In fiscal 2024, investments totaled 0.7 billion yen and expenses totaled 11.7 billion yen.
Investment/Costs (Unit:million yen)
| Category | Main Efforts | Investment | Costs | |||
|---|---|---|---|---|---|---|
| FY 2023 | FY 2024 | FY 2023 | FY 2024 | |||
| Cost in business areas | Prevention of pollution cost | Investment in pollution control facilities, and maintenance and operation costs | 41 | 45 | 82 | 67 |
| Global environmental conservation cost | Investment in energy-saving facilities, and maintenance and operations costs | 692 | 414 | 208 | 209 | |
| Resource recycling Cost | Investments in facilities for internal treatment or organic waste liquid, waste recycling costs | 786 | 105 | 211 | 171 | |
| Total | 1,520 | 564 | 502 | 446 | ||
| Upstream / downstream costs | Investment on manufacturing facilities and maintenance costs | 85 | 110 | 12 | 12 | |
| Administration cost | Costs related to environmental management system and product chemistry management | 33 | 44 | 187 | 188 | |
| R & D costs | R & D expenses related to products that contribute to reducing environmental impact such as decarbonization | 0 | 0 | 12,500 | 11,000 | |
| Social activity cost | Cost for planting trees in production sites, costs for activities contributing to local communities | 0 | 0 | 1 | 57 | |
| Environmental damage costs | Cost for reserves to respond to environmental damage, insurance costs and surcharges | 0 | 0 | 0 | 0 | |
| Other Costs | — | 0 | 7 | 236 | 14 | |
| Total | 1,640 | 724 | 13,500 | 11,700 | ||
Economic effect
Economic effect (unit: 1 million yen)
| Category | Main Efforts | Consolidated total for FY 2023 | Consolidated total for FY 2024 | Compared to the previous year | |
|---|---|---|---|---|---|
| Cost reduction effect | Total effect of saving energy and resource | Reduction of electricity, petroleum, gas and packking material used in business activities | 262 | -29 | — |
| Effect of reducing treatment cost | Reduciton of waste generated from business activities through recycling | 33 | -10 | — | |
| Total | 295 | -39 | — | ||
| Real income effect | Sales of valuable waste generated from business activities | 626 | 669 | 107% | |
| Total | 921 | 631 | |||